 English
 中文简体
中文简体 русский
 Français
 Español
 عربى
عربىContent
- 1 Why Iron Is the #1 Enemy of Calcite Powder Whiteness
- 2 Raw Material Control: Setting the Right Iron Thresholds
- 3 De-Ironing Technologies: Magnetic Separation vs. Acid Washing vs. Flotation
- 4 The Grinding Mill Factor: How Equipment Design Introduces Iron
- 5 Choosing the Right Grinding Media and Mill Liners
- 6 Process Control: A Step-by-Step SOP for Low-Iron Calcite Production
- 7 Industry-Specific Requirements: Glass, Plastics, Paints, and Paper
- 8 Cost-Benefit Analysis: Balancing Whiteness, Iron Control, and Production Cost
Why Iron Is the #1 Enemy of Calcite Powder Whiteness
Every percentage point drop in ISO brightness can cost a calcite powder supplier $15–20 per ton in lost premiums in high-end glass markets. Iron – usually present as Fe₂O₃ – is overwhelmingly the main culprit. Even when raw calcite ore appears pure, tiny amounts of iron contamination introduced during processing can shift the powder from brilliant white to an off-white, yellowish or greyish tint that is immediately rejected by buyers.
The mechanism is straightforward: iron oxides absorb light in the blue part of the visible spectrum. As the Fe₂O₃ content rises, the reflectance curve tilts, and the human eye perceives a warmer, duller color. This is not a linear nuisance – a few hundred parts per million can make the difference between a premium 96-ISO product and an industrial-grade 89-ISO filler. Processors who fail to control iron throughout the production chain end up competing on price rather than on quality.
The following table shows the typical relationship between total iron (expressed as Fe₂O₃) and measured ISO brightness for dry-ground calcite powder. The data assume no chemical bleaching or post-treatment and illustrate the steep cost of even minor contamination.
| Fe₂O₃ Content (%) | ISO Brightness Range |
|---|---|
| Less than 0.05 | 94 – 96 |
| 0.05 – 0.10 | 91 – 94 |
| 0.10 – 0.15 | 87 – 91 |
| Greater than 0.15 | Below 85 |
Iron enters the powder stream from three main sources: the raw ore itself, the wear of grinding media and mill liners, and auxiliary equipment like conveyors and classifiers. A complete low-iron strategy must address all three. Treating only one source – for example, buying high-purity ore but grinding with high-chrome cast iron rolls – is a recipe for failure.
Raw Material Control: Setting the Right Iron Thresholds
No amount of downstream technology can fix inherently impure ore. The most cost-effective iron control starts at the quarry face. Visual inspection goes only so far – a limestone with a bluish or light-gray hue is usually cleaner than one with a yellow, brown, or pink tint, but quantitative limits are essential.
For standard heavy calcium carbonate (GCC) processing, experienced suppliers set incoming ore specifications as follows: Fe₂O₃ below 0.12%, MnO below 0.006%, and hydrochloric acid insolubles below 0.30%. When ore meets these thresholds, producing powder with 91+ ISO brightness is achievable with minimal post-processing. However, different end-use markets demand far tighter control:
- Glass-grade calcite: Fe₂O₃ maximum 0.02%, ISO brightness 95+
- Plastics (PVC, masterbatch): Fe₂O₃ maximum 0.05%, ISO brightness 93+
- High-end paints and coatings: Fe₂O₃ below 0.08%, ISO brightness 92+
- Paper fillers: Fe₂O₃ below 0.10%, ISO brightness 90+
Beyond simple chemical assays, the mineralogical distribution of iron matters. Fine-grained iron oxide inclusions are harder to liberate and remove by physical means than discrete iron-rich veins. Ore blending from multiple quarry faces can buffer against batch-to-batch variation, but only if the processor maintains rigorous incoming inspection. A handheld XRF analyzer on the scale house desk is a minimum requirement – lab assays alone are too slow for real-time decision making.
De-Ironing Technologies: Magnetic Separation vs. Acid Washing vs. Flotation
Once ore is crushed, physical and chemical methods can strip out a substantial fraction of iron-bearing impurities. The three mainstream techniques – high-gradient magnetic separation (HGMS), acid washing, and froth flotation – differ dramatically in cost, efficiency, and effects on powder brightness.
High-gradient magnetic separation is the workhorse for dry and wet processing alike. Modern rare-earth drum or matrix separators can remove 70–90% of paramagnetic iron minerals at throughput costs of $3–7 per ton. They handle particle sizes from 200 mesh down to 1250 mesh and do not alter the surface chemistry of the calcite. However, ultrafine particles below 1250 mesh often suffer from lower capture efficiency, and the capital cost of a high-gradient unit can be a barrier for smaller plants.
Acid washing (typically with dilute hydrochloric or oxalic acid) attacks iron oxides chemically, leaching them from the particle surface. Removal rates of 95% are common, and the resulting brightness uplift can be 3–5 points. The downside is cost – $15–30 per ton when factoring in chemicals, effluent treatment, and drying – plus the substantial environmental permitting headache. Acid washing is best reserved for products where the end price justifies it, such as high-clarity glass or pharmaceutical-grade calcium carbonate.
Froth flotation sits between the two in both effectiveness and cost. Using fatty acid collectors and depressants, flotation can achieve 85–95% iron removal at $10–20 per ton. It is particularly effective for ores where iron is locked in liberated silicate minerals. The main drawback is that flotation requires tight pH control and a water-recycling circuit, and it produces a wet concentrate that must be dewatered and dried, adding energy cost.
| Technology | Typical Fe Removal | Cost (USD/ton) | Particle Size Range | Main Limitation |
|---|---|---|---|---|
| Dry High-Gradient Magnetic Separation | 70 – 90% | 3 – 7 | 200 – 1250 mesh | Lower efficiency on fines below 1250 mesh |
| Wet Magnetic Separation | 75 – 92% | 5 – 10 | 200 – 2500 mesh | Requires drying after treatment |
| Acid Washing (HCl or Oxalic Acid) | 90 – 95% | 15 – 30 | All fines, typically below 800 mesh | High cost and environmental compliance |
| Froth Flotation | 85 – 95% | 10 – 20 | 100 – 325 mesh feed | Dewatering and drying needed; chemical handling |
For many processors, a combination – dry HGMS after the air classifier, coupled with strict ore selection – delivers the optimum cost-to-whiteness ratio. Adding acid washing only for the premium fraction that commands a $50+ per ton premium is a proven two-tier strategy.
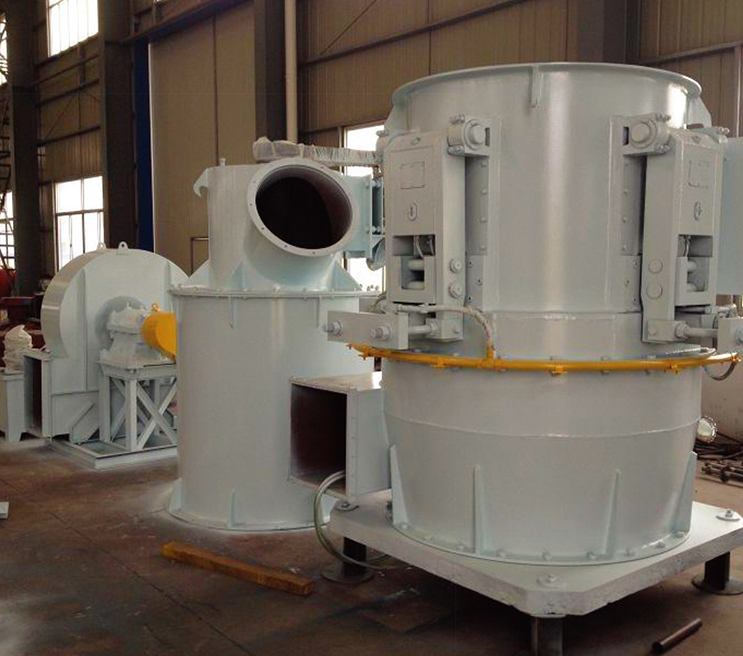
The Grinding Mill Factor: How Equipment Design Introduces Iron
Even if you start with pristine ore and use magnetic separation, a poorly chosen grinding mill can silently bleed iron back into the powder. The mechanism is simple: as grinding rolls, balls, or rings wear, microscopic ferrous particles detach and become part of the product. The rate of contamination depends on the mill type, the metallurgy of its wear parts, and the operating conditions.
Ball mills, using steel balls and steel liners, are the worst offenders. A typical dry ball mill processing calcite can add 150–250 mg of iron per kilogram of product over 1,000 operating hours. Raymond roller mills with high-chrome cast iron grinding rings and rolls fare better but still contribute 80–120 ppm. The most significant variable is the hardness of the wear components and the level of impact – cast iron parts with a hardness below 58 HRC wear faster and shed more iron.
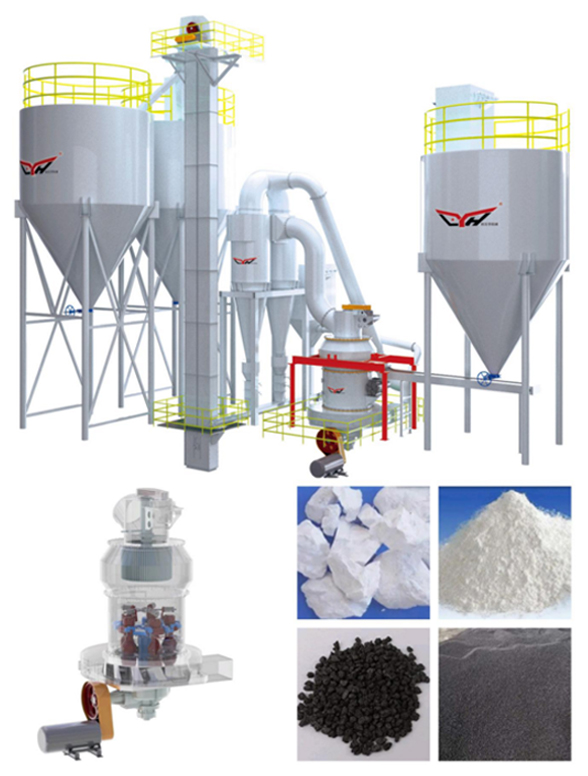
Vertical ring roller mills, especially those designed with ceramic-lined grinding tracks and composite rollers, can slash iron contamination to below 30 ppm. The reduced recirculating load and gentler grinding action minimize metal-to-metal contact. A well-designed vertical ring roller mill, such as the LYH996 Intelligent Vertical Ring Roller Mill, can maintain consistent whiteness even after thousands of hours of service because its wear parts are engineered for low-iron release.
Additionally, mill internals like the classifier rotor, reject return chutes, and the product collection cyclones all present contact surfaces. Using stainless steel or ceramic-coated steel in these areas is a small investment that pays back in preserved brightness. Many processors discover their iron problem only after switching from a ceramic-lined mill to a standard steel cyclone, only to see product color deteriorate inexplicably.
Choosing the Right Grinding Media and Mill Liners
The choice of grinding media and liner material is the most direct lever a processor can pull to cut iron contamination from the grinding circuit. The market offers a spectrum from cheap but contaminating high-chrome cast iron through to nearly inert engineered ceramics.
The table below compares four common media types on the two metrics that matter most: the iron picked up by the powder and the useful life of the media. Costs are indicative and vary with supplier and volume.
| Media Type | Iron Contamination Rate (mg/kg per 1,000 h) | Relative Media Cost | Typical Service Life (h) |
|---|---|---|---|
| High-Chrome Cast Iron Balls | 150 – 250 | 1.0 (base) | 8,000 – 12,000 |
| Quartz Pebbles | 20 – 50 | 0.6 | 2,000 – 4,000 |
| High-Alumina Ceramic Balls (92% Al₂O₃) | 5 – 15 | 2.0 – 3.0 | 15,000 – 25,000 |
| Yttria-Stabilized Zirconia Beads | Less than 2 | 8.0 – 12.0 | 20,000 – 30,000 |
For most calcite processing aimed at the 91–94 ISO brightness band, high-alumina ceramic balls and matching alumina brick liners represent the sweet spot. They offer a 15–20-fold reduction in iron pickup versus cast iron at a manageable cost premium, with long service life. Zirconia beads, while incredibly pure, are reserved for ultra-high-end applications – think pharmaceutical or optical-grade calcium carbonate – where even 2 ppm of added iron is unacceptable.
Liner material selection follows the same logic. A Raymond pendulum mill can be retrofitted with ceramic tile liners in the grinding chamber and classifier, as demonstrated in many custom installations of the LYH998 4-Roller Raymond Grinding Pendulum Mill. The same mill, when equipped with high-chrome iron liners, can produce powder that is 2–3 ISO points lower than the identical ore processed through a ceramic-lined sibling. The rule: pair ceramic media with ceramic liners, and never mix metallic and non-metallic wear parts in the same circuit.
Process Control: A Step-by-Step SOP for Low-Iron Calcite Production
Consistently producing high-whiteness, low-iron calcite powder demands a disciplined, documented process that starts at the quarry and ends at the packaging line. The following standard operating procedure (SOP) checklist has been distilled from full-scale GCC plants that ship glass-grade powder daily.
- Ore selection and blending: Test each truckload or bench with portable XRF. Reject or blend any batch exceeding 0.10% Fe₂O₃ for premium runs.
- Primary crushing: Pass all crushed rock over a magnetic pulley separator to remove tramp iron from mining equipment.
- Secondary crushing and screening: Use a suspended permanent magnet over the belt and a metal detector ahead of the fine crusher. Inspect crusher liners monthly for wear.
- Storage and feed: Store crushed stone in clean, lined bins. Avoid cross-contamination from iron-rich minerals handled in adjacent bays.
- Grinding circuit: Use a mill equipped with ceramic liners and high-alumina media. Set operating parameters (load, speed, temperature) per the mill manufacturer's low-wear profile.
- Air classification: Route product through a classifier with stainless steel rotor and liners. Monitor cut point daily; off-spec fines can concentrate iron oxides.
- Dry magnetic separation: Install a rare-earth high-gradient magnetic separator immediately after the classifier. Run all product for premium grades; bypass only for economy grades.
- Quality check point: Sample powder every two hours for ISO brightness and lab Fe₂O₃. Trend data to detect gradual equipment wear.
- Packaging: Pass filled bags or bulk totes through a final metal detector. Use plastic or stainless steel contact surfaces throughout the packaging line.
Documentation is as important as hardware. A shift log that tracks feeder amps, mill vibration, and magnetic separator rejection rates often reveals the onset of liner failure days before a brightness drop appears. By integrating these signals into a smart process control system, a plant can schedule liner changes proactively rather than reacting to customer complaints.
Industry-Specific Requirements: Glass, Plastics, Paints, and Paper
Not all calcite powders need to be 96 bright. Understanding the exact specification window for the target market prevents overspending on iron removal while still meeting the customer’s functional needs. The following table summarizes the typical quality demands of four major sectors.
| Industry | Minimum ISO Brightness | Maximum Fe₂O₃ (ppm) | Typical Particle Size (d97) | Key Quality Driver |
|---|---|---|---|---|
| Glass (container, flat) | 95 | 200 | 45 – 150 µm | Clarity and color; iron causes green tint |
| Plastics (PVC profiles, masterbatch) | 93 | 500 | 5 – 20 µm | Dispersion and whiteness retention after heat |
| Decorative paints | 92 | 800 | 2 – 10 µm | Opacity and tint strength |
| Paper (filler, coating) | 90 | 1000 | 1 – 3 µm | Brightness and sheet smoothness |
Glass manufacturers are the most demanding. Even 500 ppm of Fe₂O₃ can produce a noticeable green tint in clear container glass. Consequently, glass-grade calcite commands a $40–60 per ton premium over plastics-grade powder. Plastics and paint producers, while less stringent, will still reject loads that drift below the agreed brightness because their own formulations depend on consistent hiding power and color. Paper mills, often blending multiple fillers, can tolerate slightly higher iron if the overall sheet brightness target is met. Matching the process intensity to the specification avoids wasting capital on unneeded de-ironing.
Cost-Benefit Analysis: Balancing Whiteness, Iron Control, and Production Cost
The decision of how far to push iron removal comes down to a single question: does the premium in the selling price cover the added processing cost? A structured cost-benefit model helps processors pick the right strategy for their market position.
The table below outlines three archetype scenarios: a “Premium” route that combines acid washing or intensive magnetic separation, a “Standard” route relying on high-quality ore and a dry magnetic separator, and an “Economy” route that controls only raw material iron and accepts the resulting brightness. Capital costs are for a 30,000-ton-per-year line.
| Parameter | Premium (Acid Wash + Magnetic) | Standard (Magnetic Only + Ceramic Mill) | Economy (Raw Material Control) |
|---|---|---|---|
| Additional Capital Investment | $400,000 – $600,000 | $150,000 – $250,000 | Minimal ($20,000 for magnets) |
| Operating Cost Add-on (USD/ton) | 18 – 28 | 5 – 9 | 1 – 2 |
| Typical Final Fe₂O₃ | Below 200 ppm | 300 – 600 ppm | 600 – 1,200 ppm |
| ISO Brightness Achievable | 94 – 96 | 91 – 93 | 87 – 90 |
| Product Selling Price (ex-works, USD/ton) | 120 – 160 | 80 – 100 | 50 – 70 |
| Target Markets | Glass, pharma, high-end coatings | Plastics, general paints, paper | Construction fillers, low-end tile |
For a plant already selling into the glass supply chain, the premium path yields a net margin lift of $30–40 per ton after deducting the extra processing cost. For others, the standard approach – ore selection plus a dry magnetic separator and ceramic grinding system – delivers the highest return on incremental capital. The economy route only makes sense when the quarry has naturally low-iron stone and the customer base has modest brightness expectations.
Energy cost also factors into the equation. A mill that runs with excessive recirculation or worn liners not only raises iron contamination but also pushes kilowatt-hours per ton higher. By combining iron-control measures with practical energy-saving levers, a processor can cut both iron and energy in one systematic optimization project.
